The Office for National Statistics puts the average private rent in Enfield at £1,827 a month in August 2026, the latest month it has published. London as a whole averaged £2,332 and England £1,459. ONS publishes no separate figure for Edmonton, which sits inside the borough. The Enfield number is the closest ONS figure to Edmonton's rents. It averages every privately rented home in the borough, including tenancies that began months ago. A home advertised today can sit above or below it.
The short version
- ONS published these figures at 9:30am on 16 September 2026. They cover rents to August 2026.
- By bedroom size, Enfield averages £1,422 (one bedroom), £1,764 (two), £2,098 (three) and £2,807 (four or more).
- The index covers new and existing tenancies. The rents on portals are adverts for new lets. Use the ONS figure as a benchmark and ask for a valuation before pricing a particular home.
What is the average rent in Enfield by bedroom size?
ONS publishes an average monthly rent for each local authority in England and Wales, split by bedrooms and property type. These are the August 2026 figures from its 16 September 2026 dataset.
| Bedrooms | Enfield | London | England |
|---|---|---|---|
| All private rented homes | £1,827 | £2,332 | £1,459 |
| One | £1,422 | £1,760 | £1,195 |
| Two | £1,764 | £2,232 | £1,335 |
| Three | £2,098 | £2,643 | £1,489 |
| Four or more | £2,807 | £3,646 | £2,161 |
By property type, the same release gives these averages.
| Property type | Enfield | London | England |
|---|---|---|---|
| Flat or maisonette | £1,656 | £2,056 | £1,444 |
| Terraced | £2,039 | £2,840 | £1,435 |
| Semi-detached | £2,430 | £2,946 | £1,449 |
| Detached | £2,570 | £2,920 | £1,640 |
A two-bedroom home in Enfield averages £468 a month less than the London figure (£2,232 less £1,764), or £5,616 over 12 months, and £429 a month more than the England figure (£1,764 less £1,335).
ONS does not publish how many rents sit behind each property-type figure, and the detached and semi-detached rows will rest on fewer records than flats.
How does Enfield compare with Barnet, Haringey and Waltham Forest?
| Area | All private rented homes | Two bedrooms |
|---|---|---|
| Enfield | £1,827 | £1,764 |
| Barnet | £1,949 | £1,858 |
| Haringey | £2,219 | £2,034 |
| Waltham Forest | £1,763 | £1,723 |
| London | £2,332 | £2,232 |
| England | £1,459 | £1,335 |
These are borough averages for one month. ONS says local figures can be volatile and should be read against longer-term trends, so we do not rank boroughs on them and make no forecast.
What do the ONS rent figures measure?
The index is called the Price Index of Private Rents. These are the points that matter for Enfield, taken from ONS's quality and methodology information.
- All tenancies. It covers the stock of privately rented homes, new and existing tenancies together. In England the data are achieved rents, meaning what tenants pay, and ONS says it cannot tell whether a record is a new let, a renewal or an existing tenancy.
- Where the data come from. Rent Officers collect rents from letting agents and landlords who are willing to provide them, as part of their work on Housing Benefit and Universal Credit. ONS calls the sample purposive, meaning chosen rather than random, and uses expenditure weights to allow for uneven collection across areas.
- How many rents. ONS's latest data volumes file (25 March 2026) shows 1,155 rents in the model's monthly dataset for Enfield in December 2025, against more than 500,000 across the UK. The same file says the index excludes rooms.
- Modelled pounds. The pound figures are estimated average rents from a statistical model. ONS starts from a base set of January 2023 prices and moves them forward with the index.
- Status. ONS classes the series as official statistics. It stopped calling them "in development" on 20 May 2026, and says it has not yet reached accredited status.
- Smoothed and carried forward. If no new price is collected, ONS assumes a rent stays the same for up to 14 months. Estimates below regional level, including Enfield, are a three-month moving average.
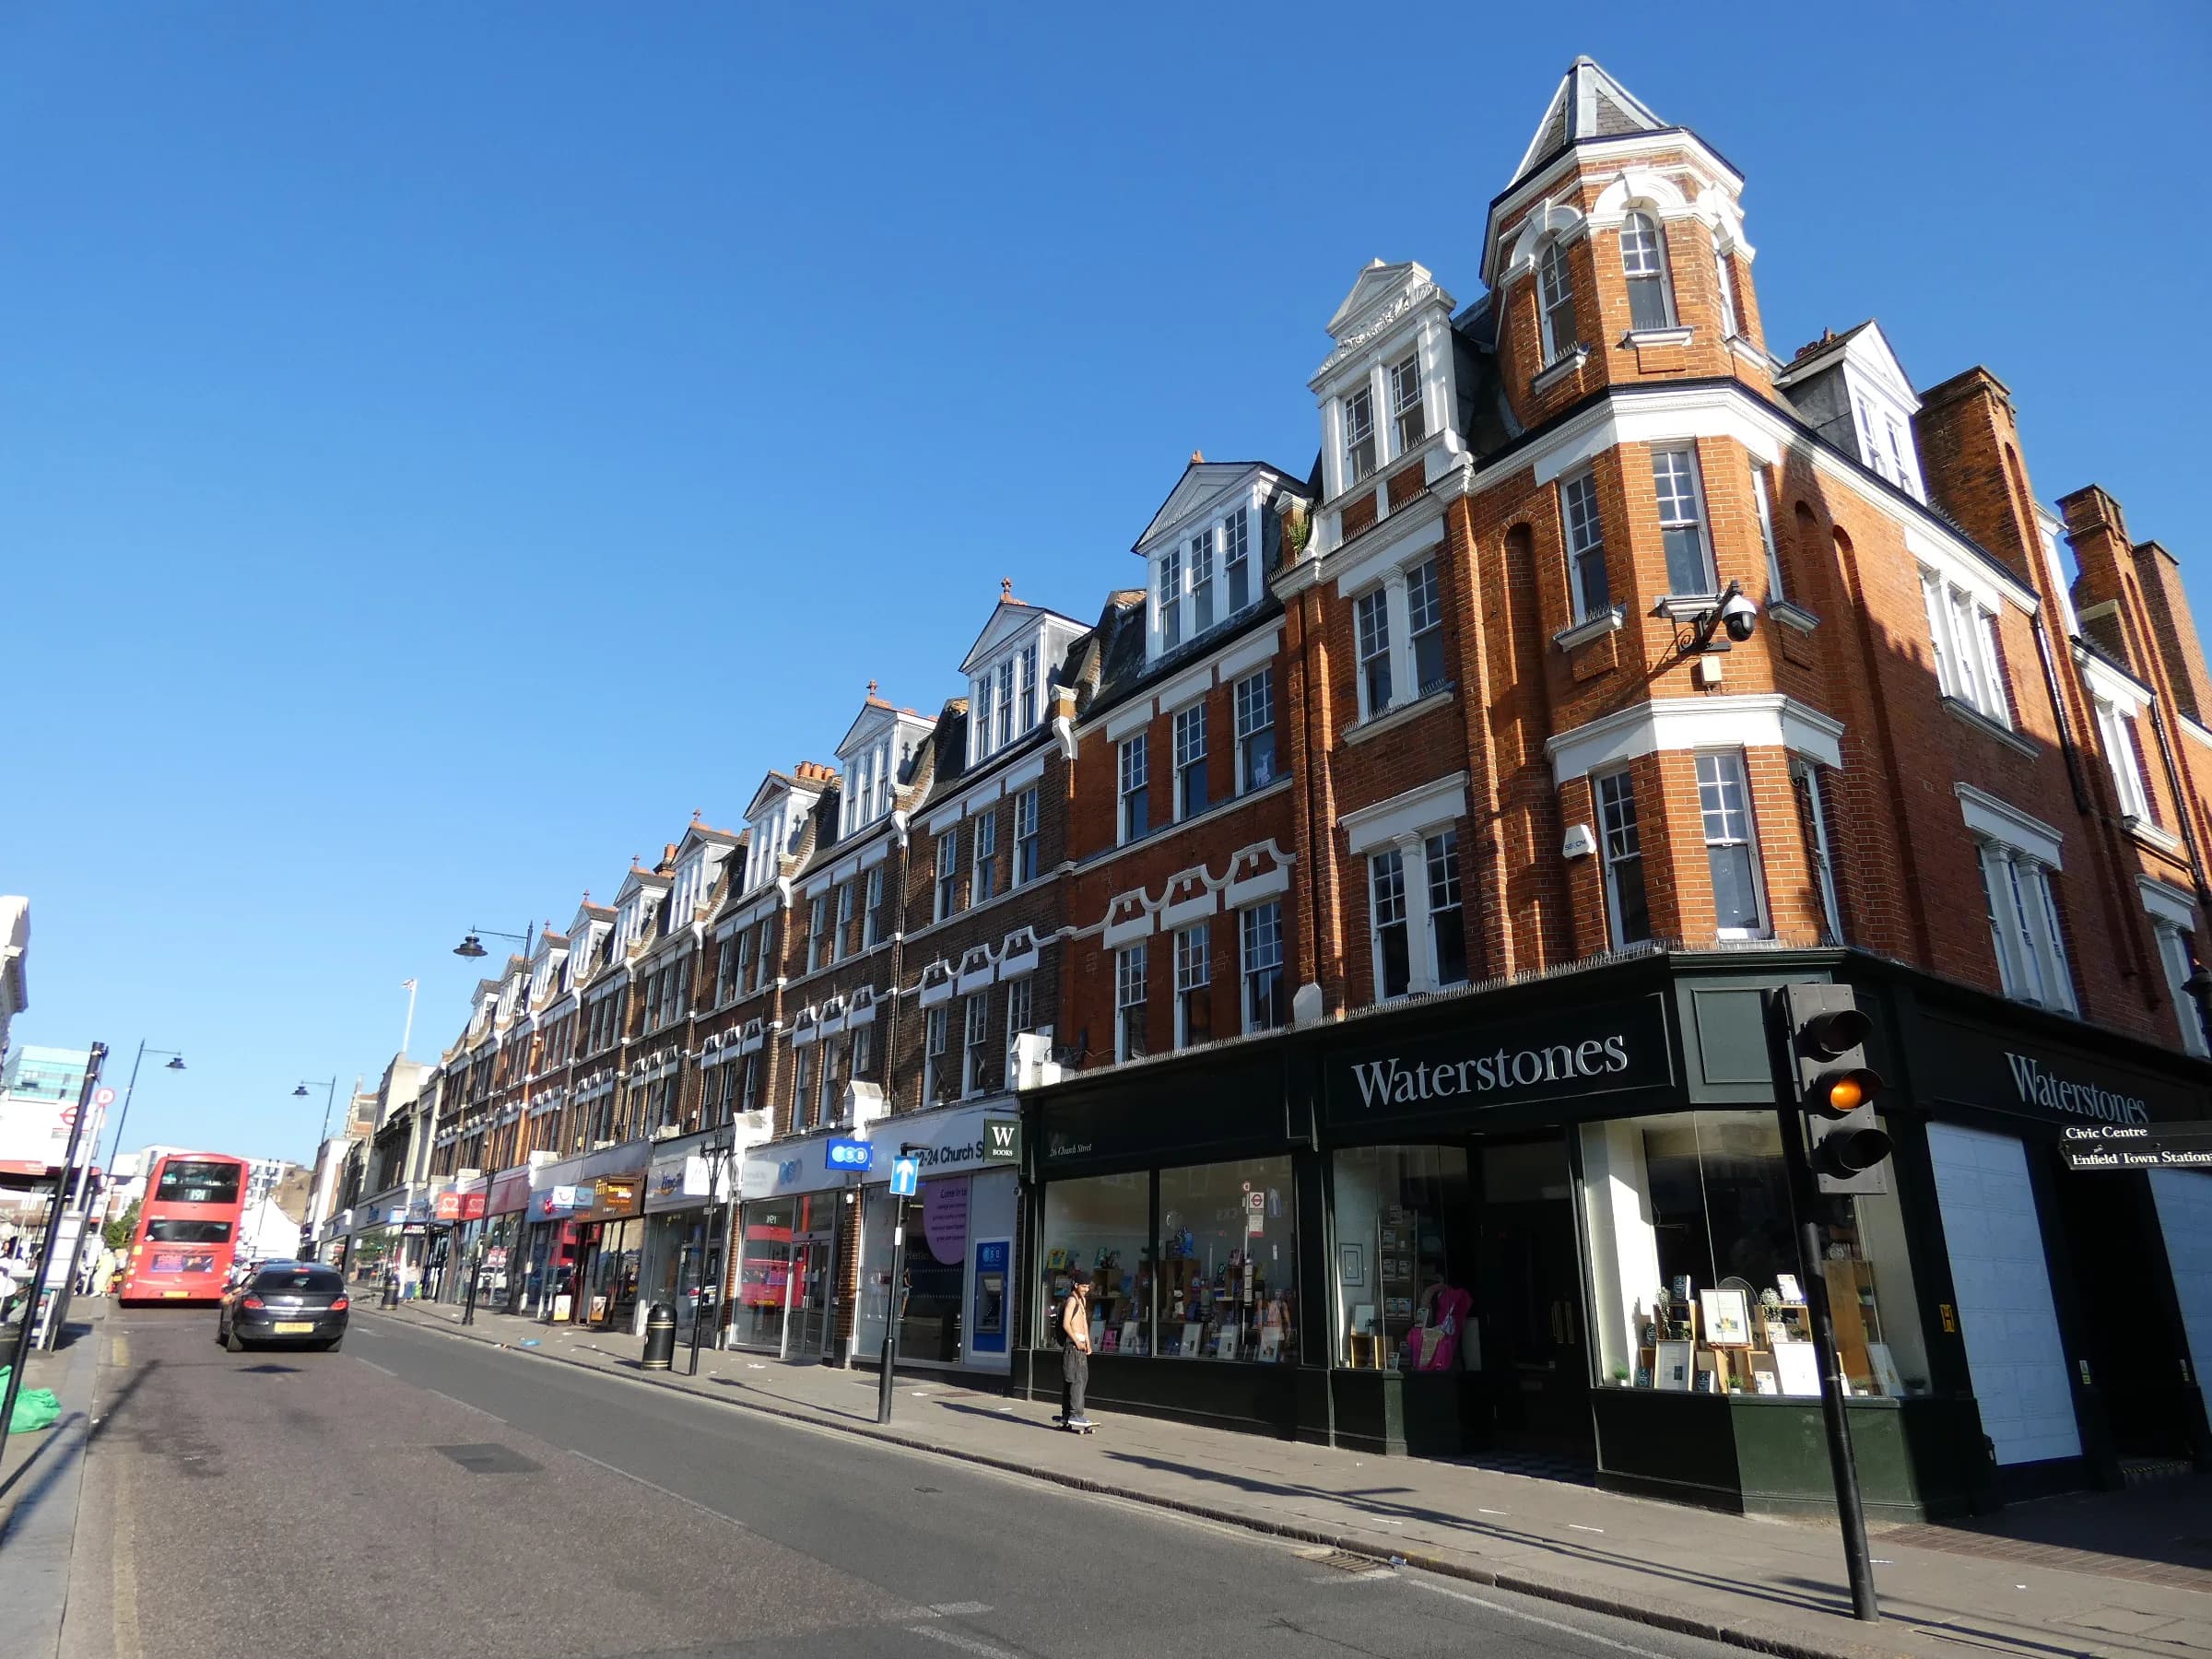
- Geography. The unit is the local authority. Enfield covers Edmonton, Ponders End, Palmers Green, Southgate and Enfield Town. Our Edmonton area guide covers the N9 and N18 postcodes, and our sold-price article for Edmonton and Enfield covers what homes sell for.
The August figure rests on rents recorded over roughly the past 14 months, then averaged over three months. It shows where the borough's rents sit. On our reading it says little about what a tenant signing this week will be asked.
Why do ONS rents differ from the rents on property portals?
ONS says private firms such as Homelet, Rightmove and Zoopla measure advertised rents for new lets. Those adverts include homes that never let, and they miss cases where the rent achieved differs from the advert. ONS also says advertised prices are generally much quicker to reflect changes in market conditions, while its stock measure is steadier. It publishes a comparison of the two each January.
GOV.UK's guidance for landlords of assured tenancies in England says an advert must state a specific rent, not a range, and that a landlord or agent cannot ask for, encourage or accept an offer above it. A council may fine up to £7,000 for a first offence.
How current are the ONS rent figures?
ONS published August's rents on 16 September 2026, just over two weeks after the month ended. Its release calendar lists the next release for 21 October 2026. We compared the 19 August 2026 and 16 September 2026 editions of the dataset: Enfield's July 2026 average is £1,821 in both.
You may meet figures from ONS's older series, Private rental market summary statistics in England. It is discontinued. Its last edition covered October 2022 to September 2023, was released on 20 December 2023, and reported medians. That is a different measure from the current index.
How to use this if you are renting or letting in Edmonton
- Tenants: match an advert to the right bedroom row in the first table. A large gap is a reason to ask questions, because the ONS row includes older tenancies. Our guide to how renting works and your rights as a tenant cover the process, and you can register to rent with us.
- Comparing boroughs: use the same bedroom column for each. The £468 monthly gap between Enfield and London for two bedrooms is a borough average, so check the actual homes.
- Landlords setting a rent: an area average does not value your property. Street, condition, size and furnishing all matter, and our guide to marketing your property explains what makes an advert work.
- Landlords raising a rent: a tenant who thinks a proposed rent is too high can ask the tribunal to decide an open market rent. HM Courts and Tribunals Service says information from letting agents or websites such as Rightmove and Zoopla can help but evidence from actual agreed lettings is stronger. On our reading an ONS area average is background only and says nothing specific about your property. Our article on raising the rent under the Renters' Rights Act sets out the steps.
If you own a home to let around Edmonton and want a rent figure for your own property, ask for our free lettings valuation.
Questions readers ask
What is the average rent in Enfield?
The Office for National Statistics estimates average private rent in the London Borough of Enfield at £1,827 a month in August 2026. By bedroom size it is £1,422 for one bedroom, £1,764 for two, £2,098 for three and £2,807 for four or more. These are averages for all privately rented homes, not asking rents.
How much does it cost to rent in Edmonton?
ONS has no figure for Edmonton on its own. Edmonton is part of the London Borough of Enfield, where ONS puts the average private rent at £1,827 a month in August 2026, or £1,764 for two bedrooms. The borough also covers Southgate and Enfield Town, so a rent advertised for a particular Edmonton home may sit above or below that.
Why do ONS rents differ from the rents on property portals?
ONS measures the rents of all privately rented homes, new and existing. Portal measures use advertised rents for new lets, which ONS says are generally much quicker to reflect changes in the market. Adverts can also include homes that never let. The two numbers answer different questions and should not be set side by side as if they were the same.
Does the ONS figure include rooms in shared houses?
No. ONS's data volumes notes say the Price Index of Private Rents excludes rents data for rooms. The Enfield figures describe whole privately rented homes, so they say little about what renting a single room in a shared house costs in Edmonton or elsewhere in the borough.
When will the figures change?
ONS publishes private rent statistics monthly. The figures used here came out on 16 September 2026 and cover August 2026. ONS's release calendar lists the next release for 21 October 2026. After that date, check the new bulletin, because the Enfield figures in this article will have been overtaken.
Sources
- Office for National Statistics, Private rent and house prices, UK: September 2026, released 16 September 2026, read on 17 October 2026.
- Office for National Statistics, Price Index of Private Rents, UK: monthly price statistics, 16 September 2026 edition (Table 1, August 2026 rows for Enfield, London and England), read on 17 October 2026.
- Office for National Statistics, Price Index of Private Rents, UK: monthly price statistics, 19 August 2026 edition (Enfield July 2026 row), read on 17 October 2026.
- Office for National Statistics, Price Index of Private Rents quality and methodology information, last revised 20 May 2026, read on 17 October 2026.
- Office for National Statistics, How we measure rental price inflation, 1 April 2025, read on 17 October 2026.
- Office for National Statistics, Price Index of Private Rents, UK: data volumes, released 25 March 2026, read on 17 October 2026.
- Office for National Statistics, Release calendar: Private rent and house prices, UK: October 2026, read on 17 October 2026.
- Office for National Statistics, Private rental market summary statistics in England (discontinued; last release 20 December 2023), read on 17 October 2026.
- GOV.UK, Assured periodic tenancies: a guide for landlords, Rental bidding, read on 17 October 2026.
- HM Courts and Tribunals Service, Apply for an open market rent determination, published 14 January 2026, last updated 10 August 2026.