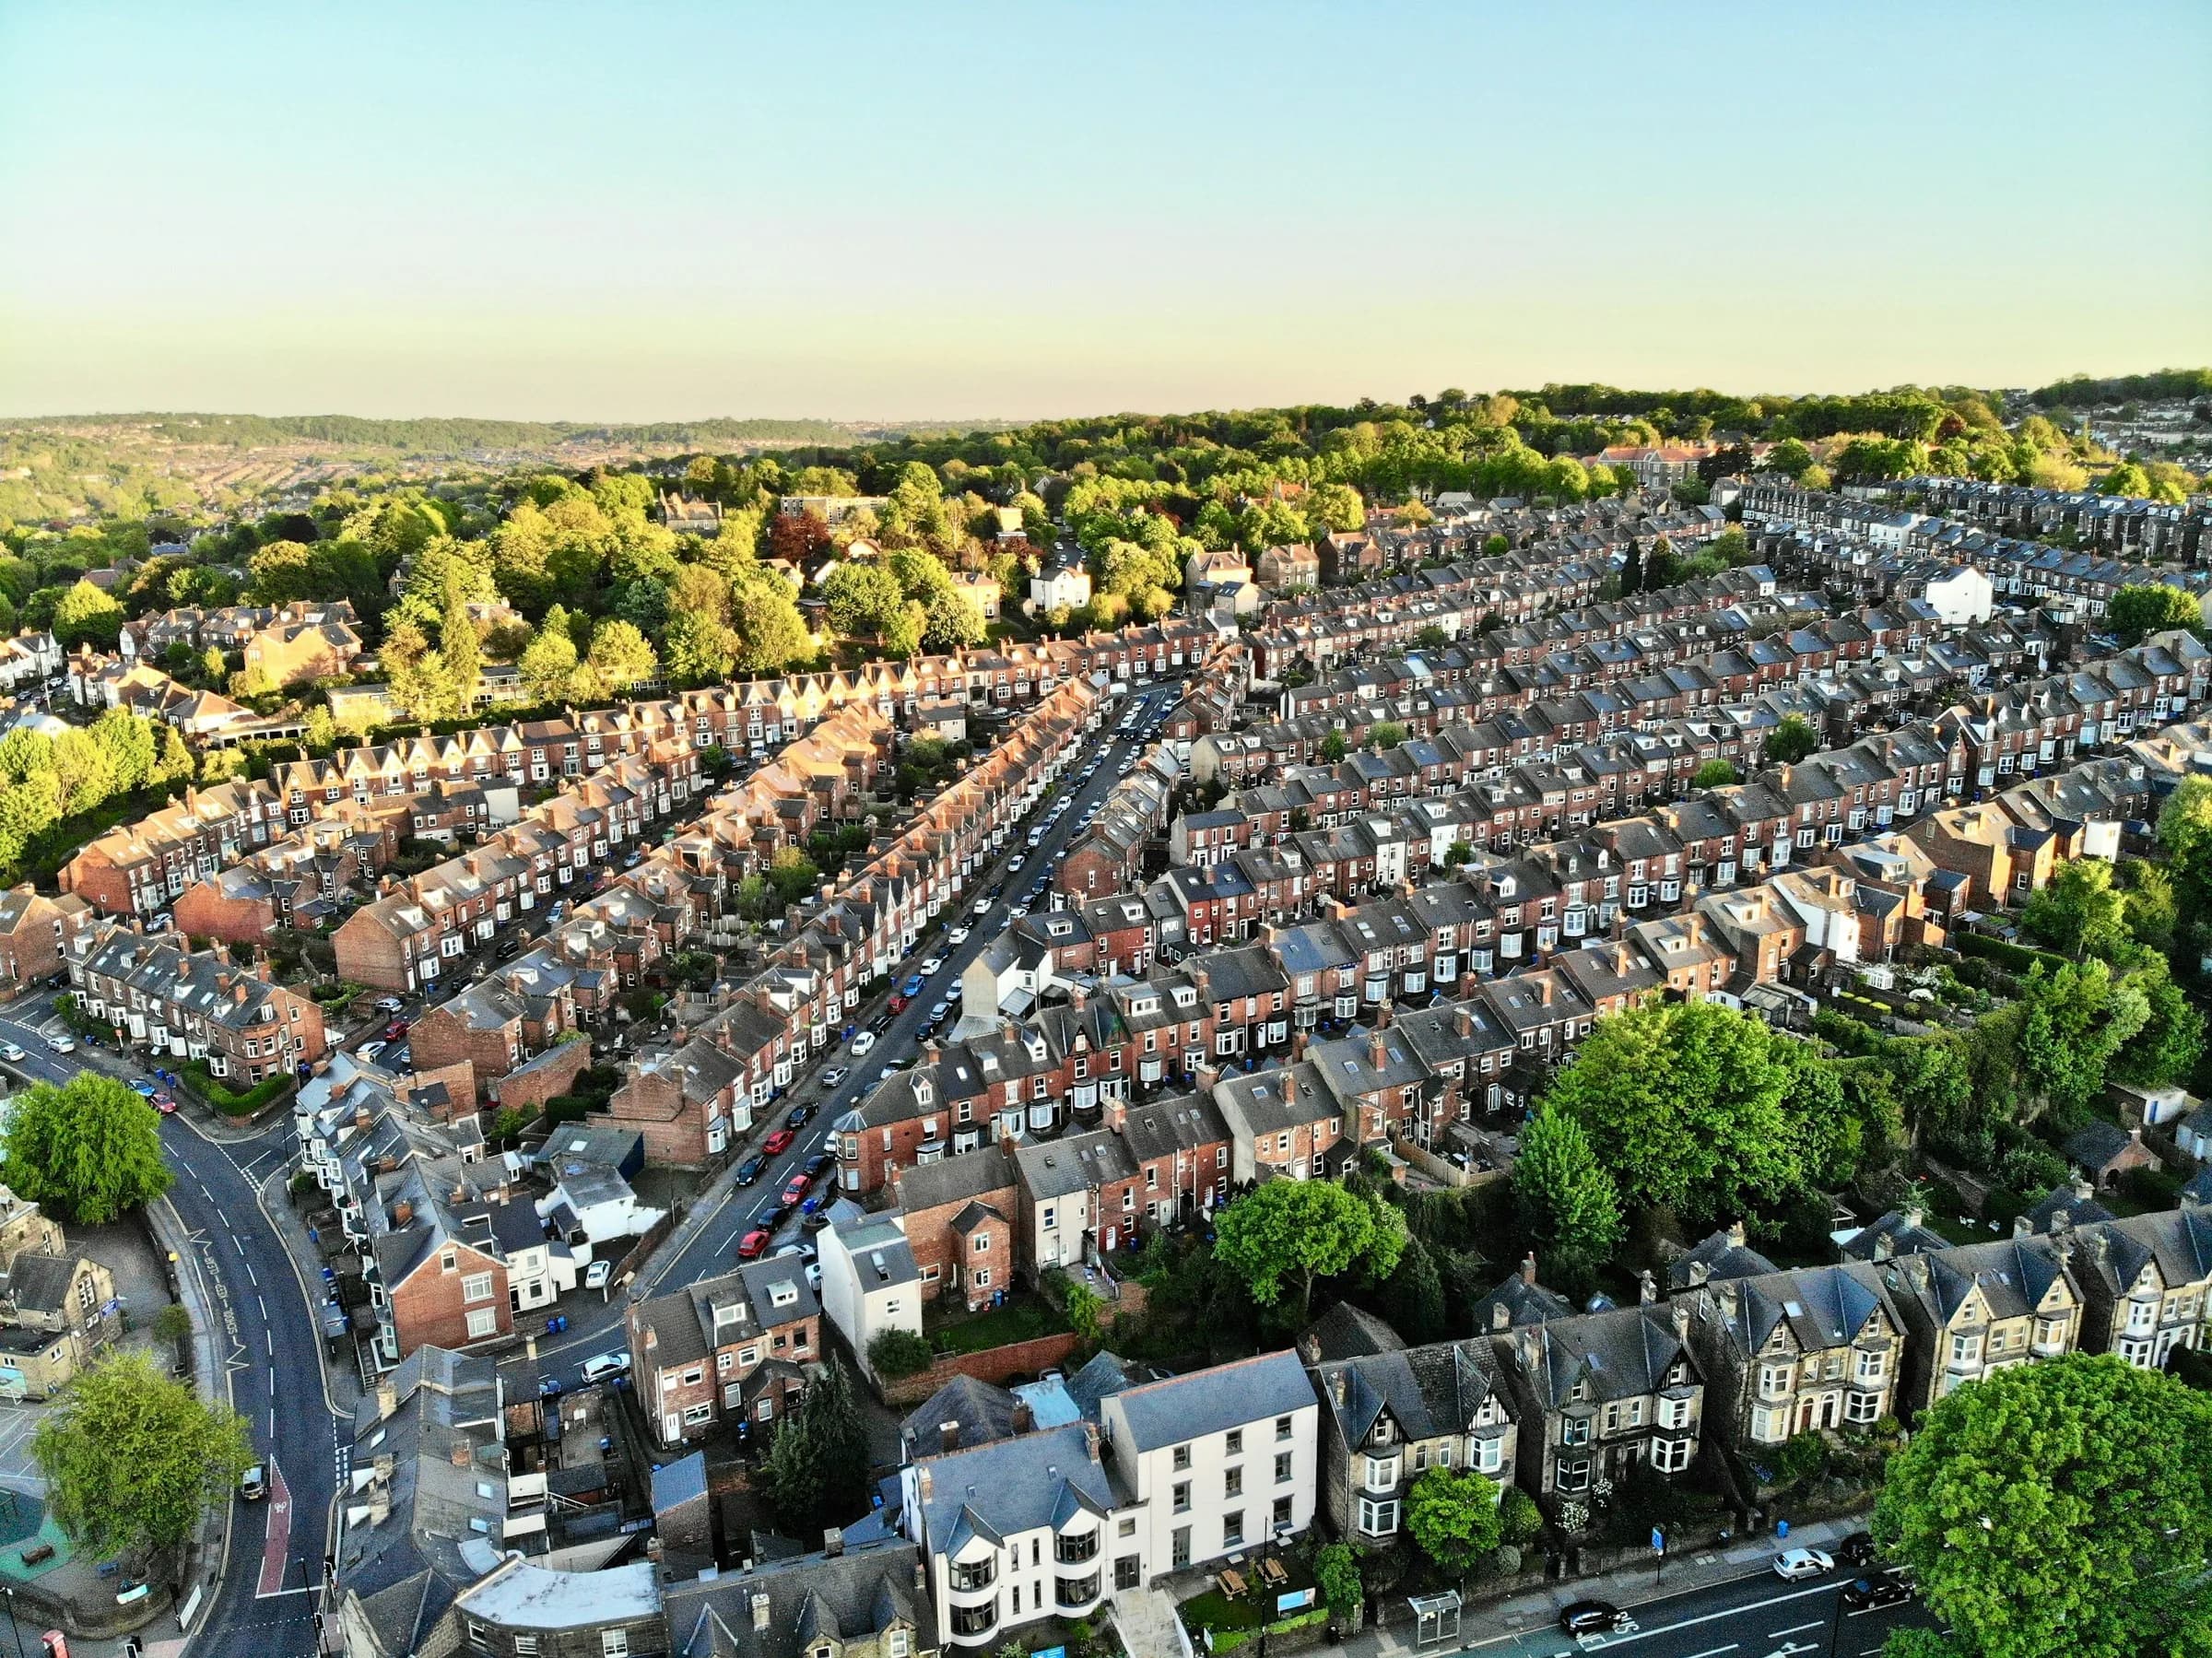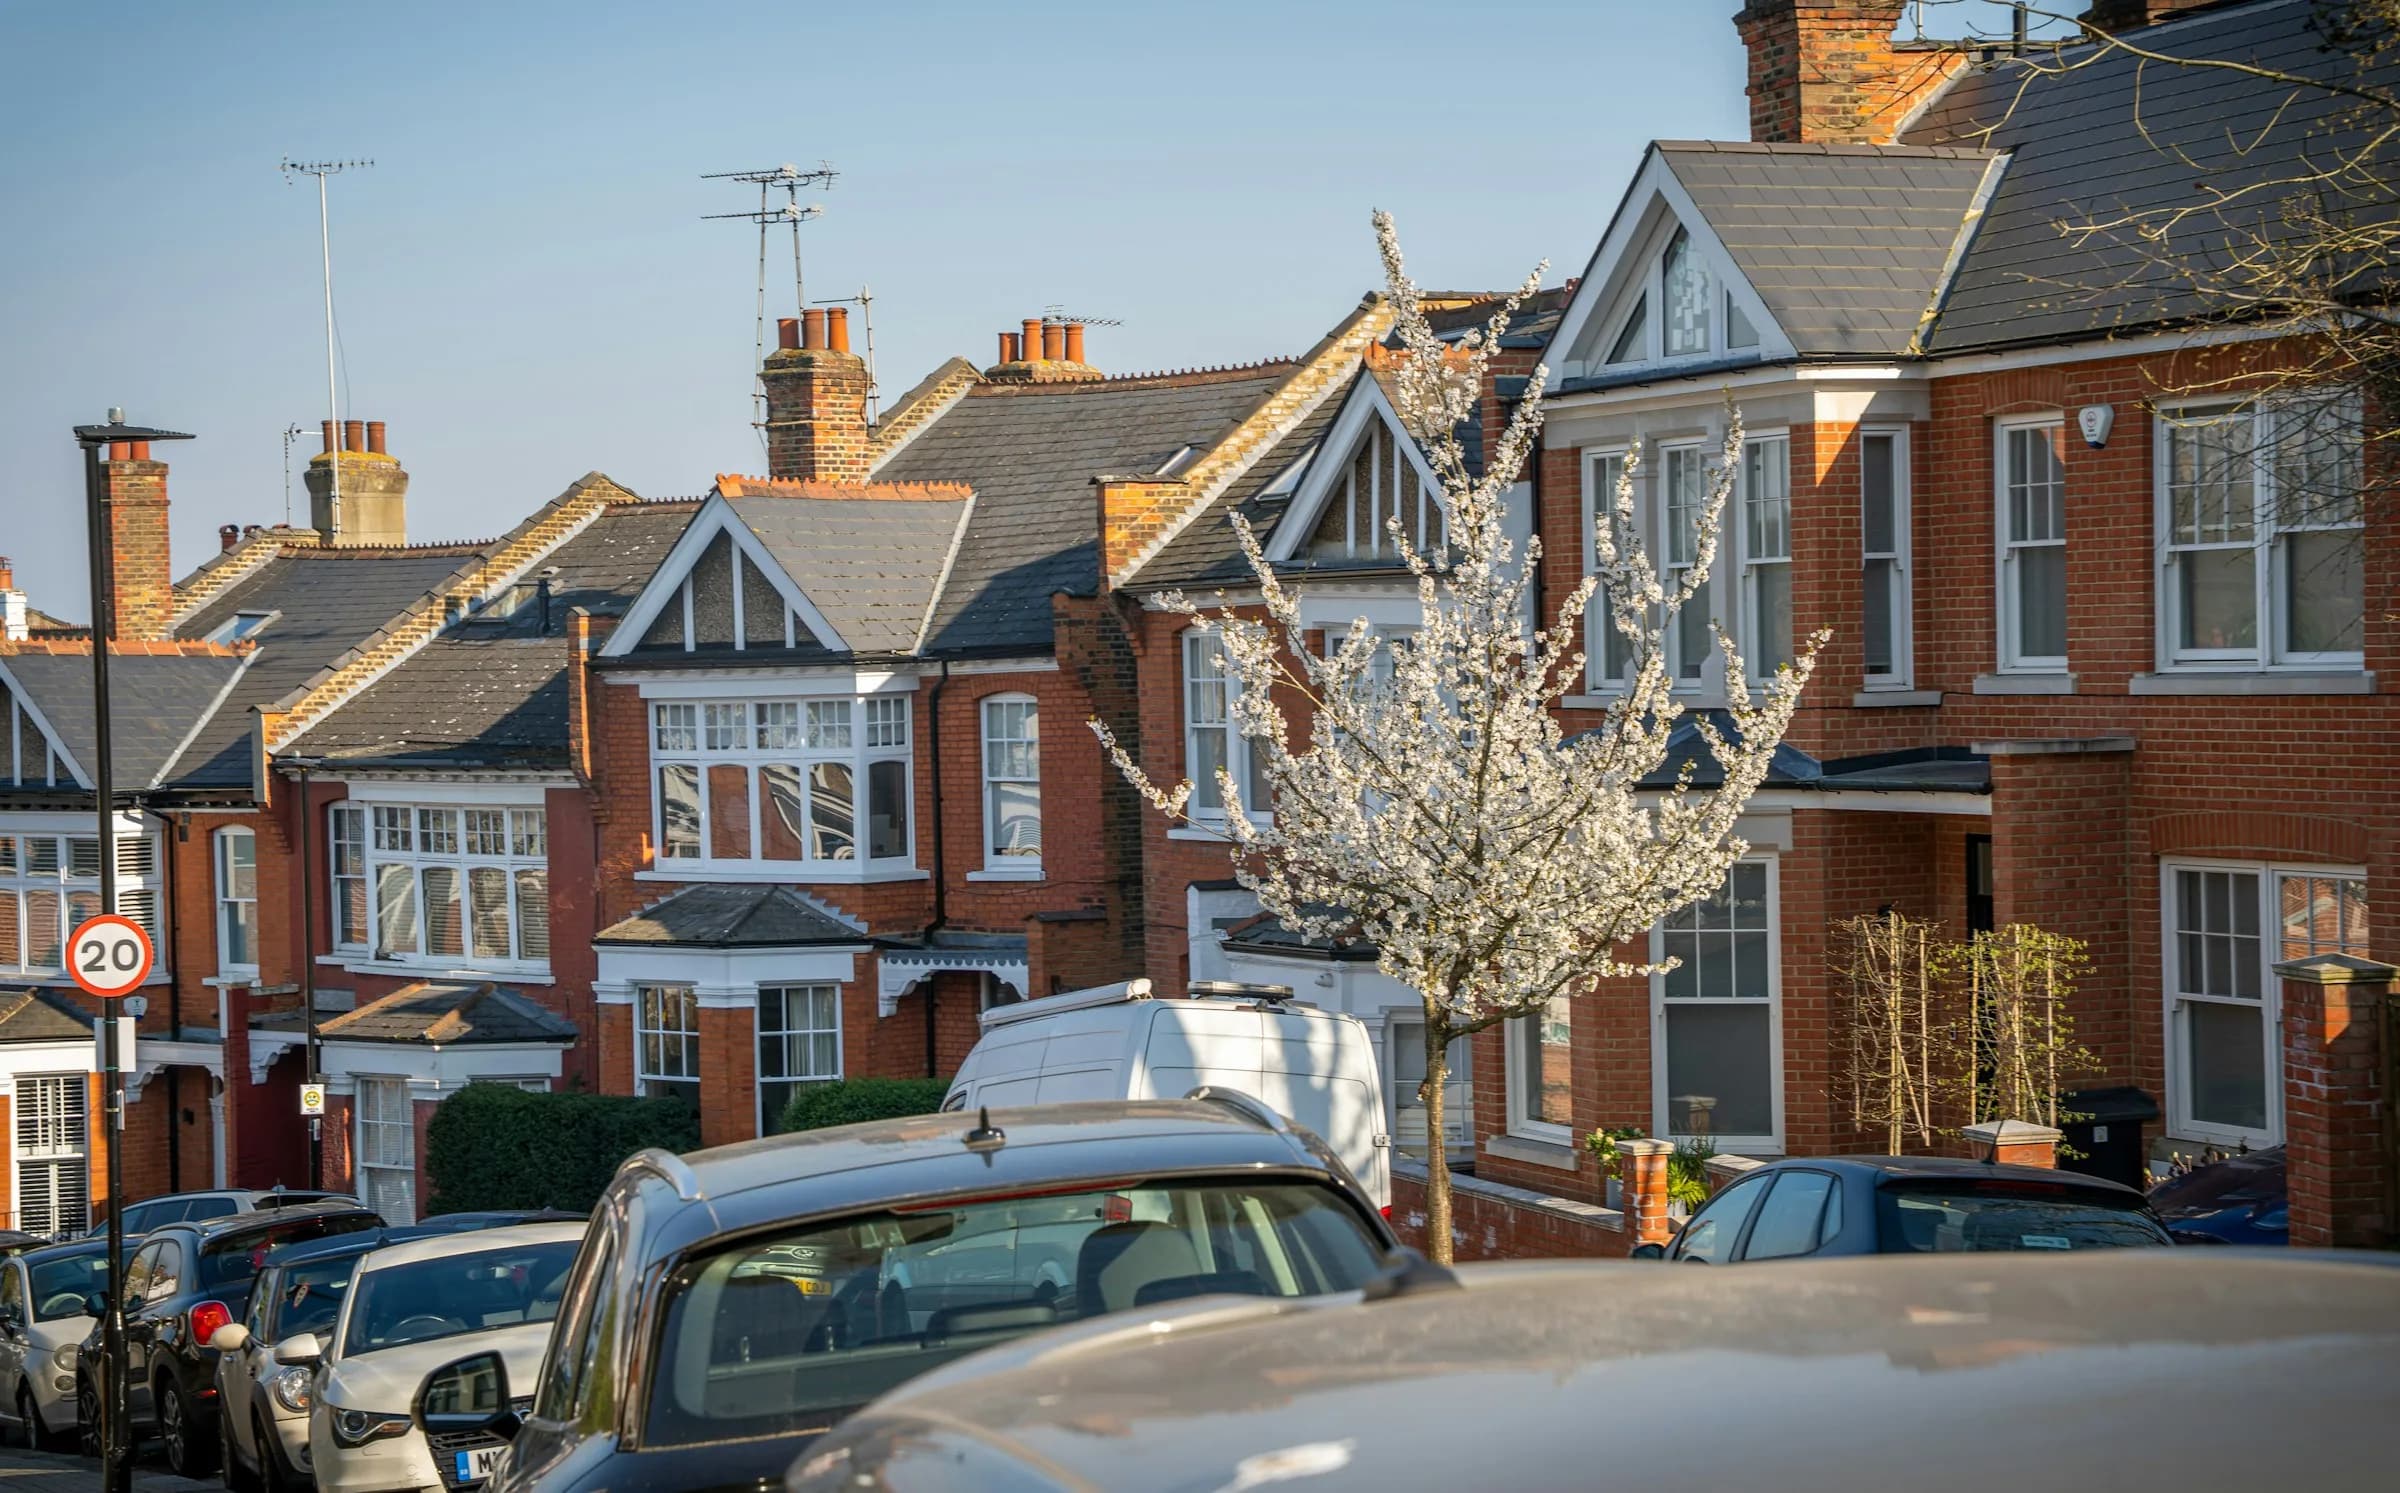
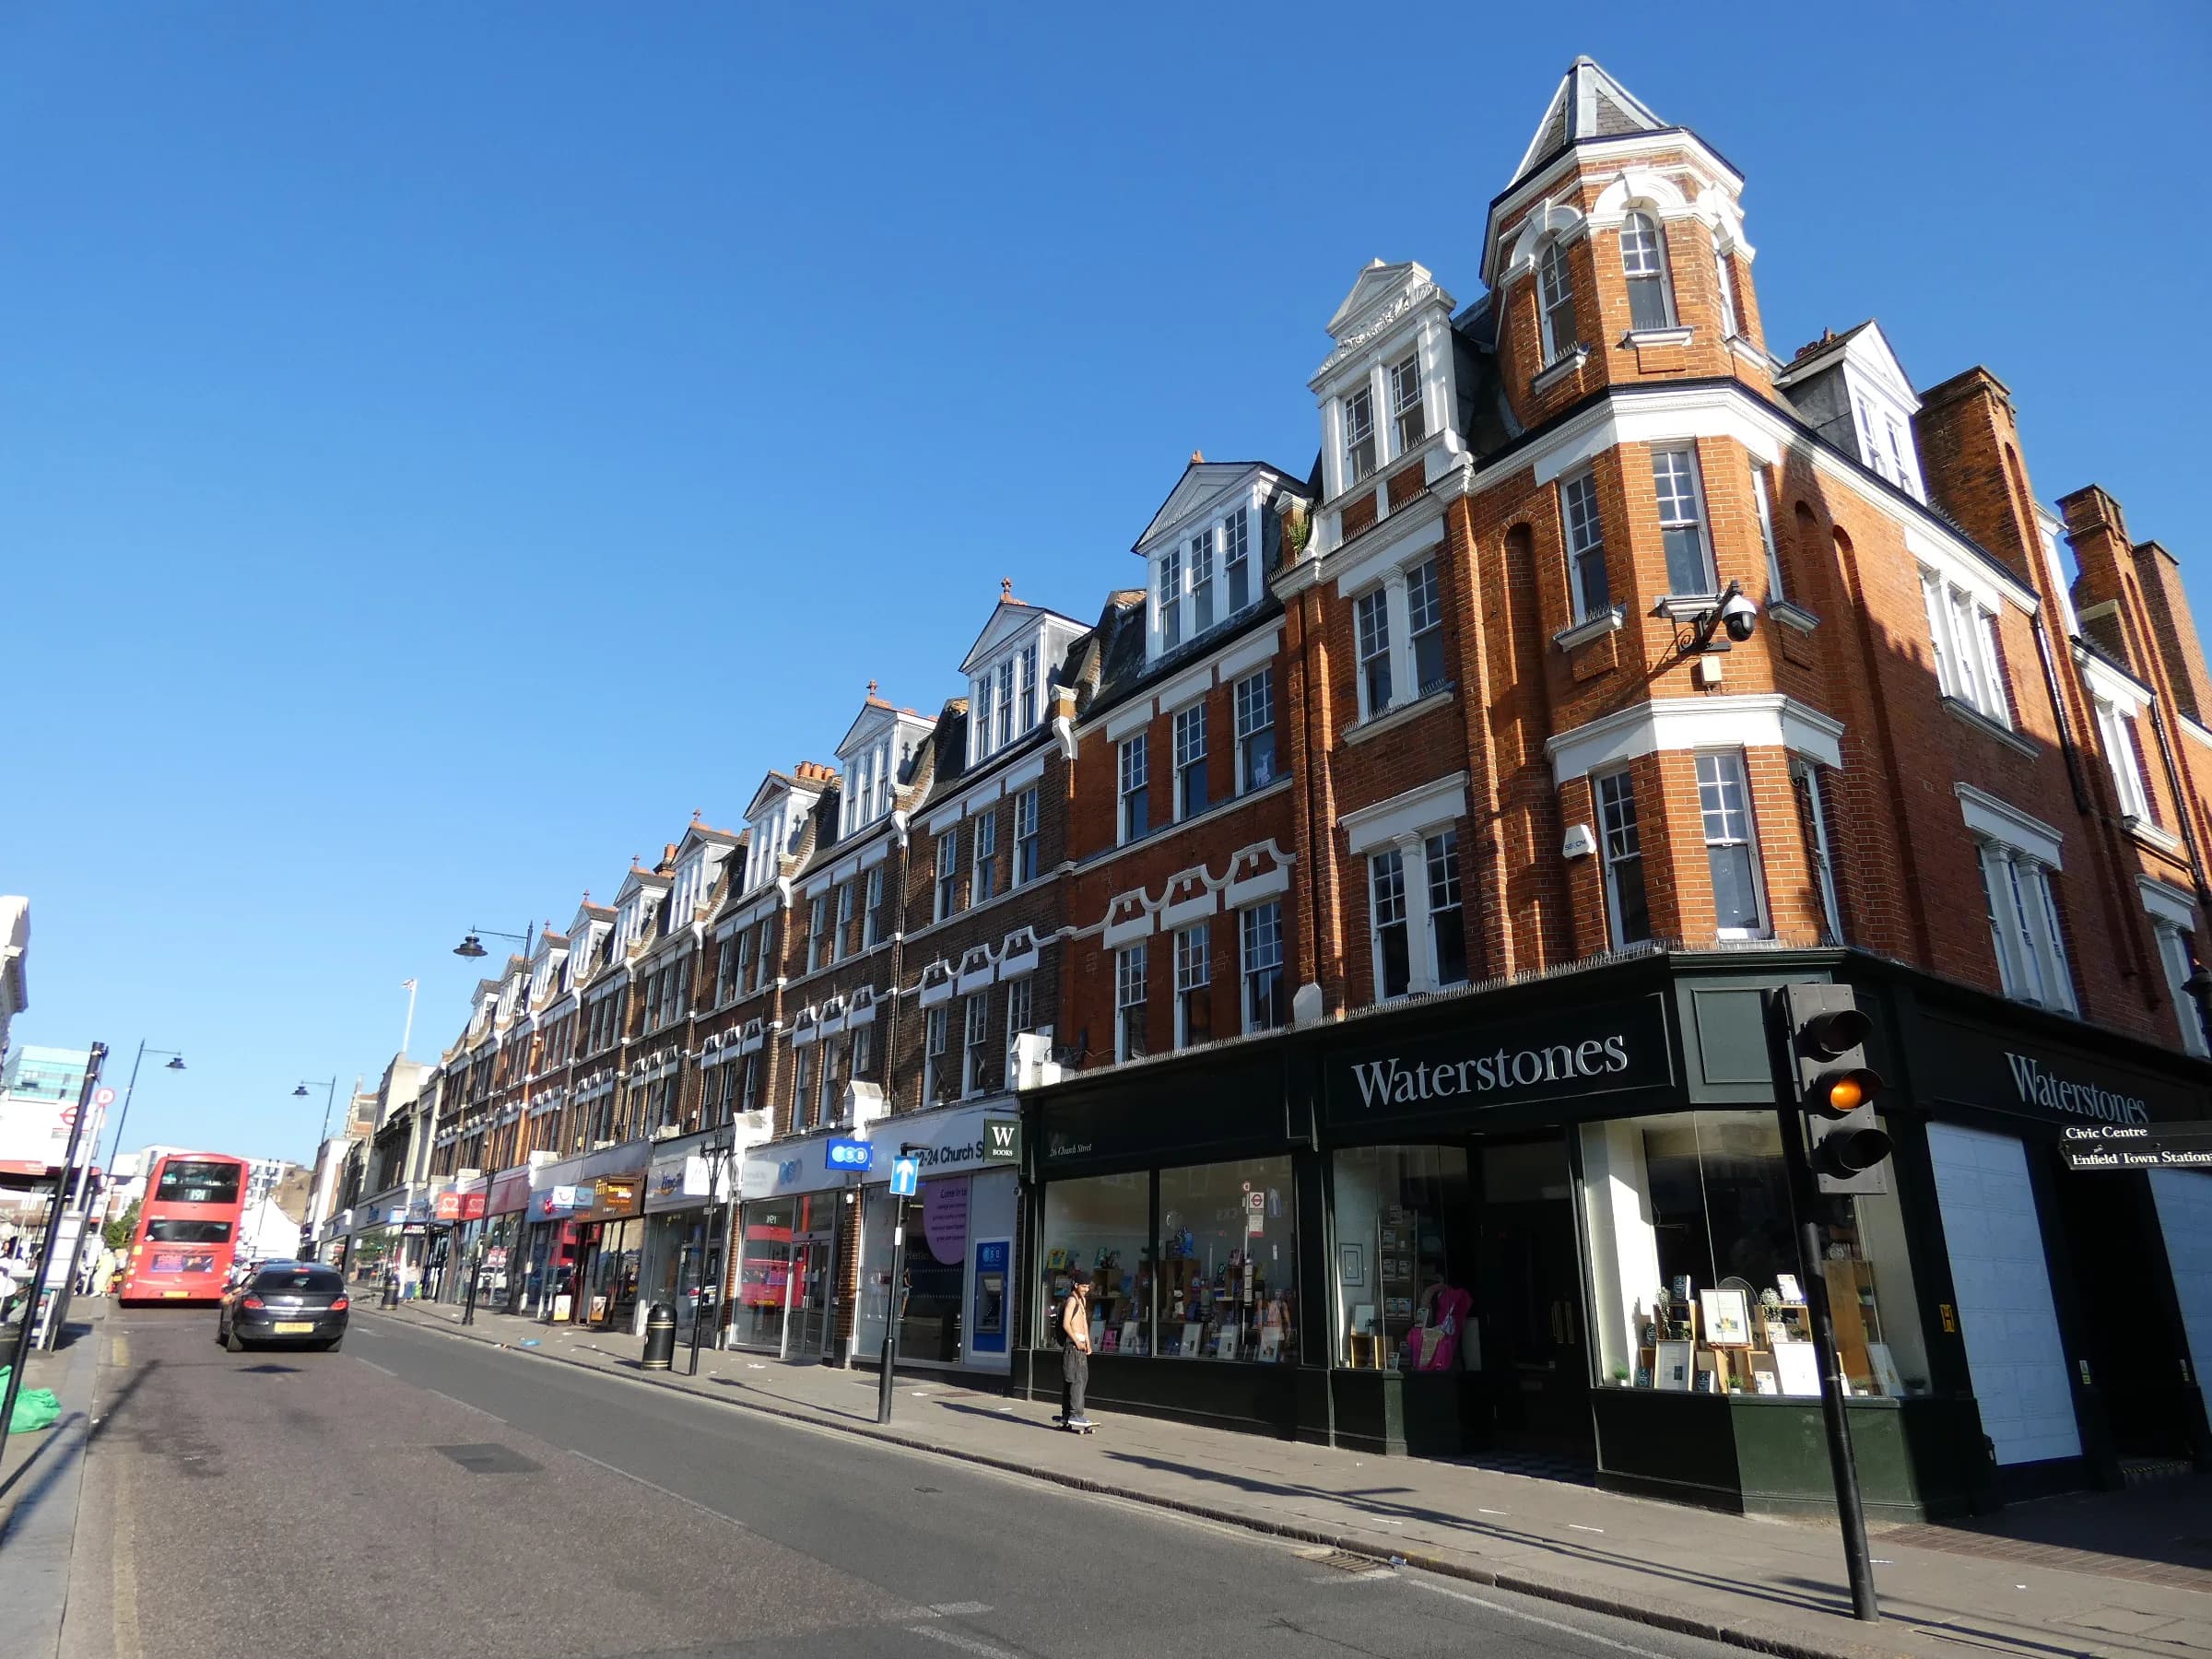
In the 12 months to July 2026, the typical sale price around our Edmonton office ranged from £410,000 in Ponders End to £700,000 in Southgate and Oakwood. Property type made a large difference everywhere, as the second table shows.
Median sold prices by area
| Area | Postcodes | Median price | Standard sales |
|---|---|---|---|
| Southgate and Oakwood | N14 | £700,000 | 221 |
| Winchmore Hill | N21 | £650,000 | 216 |
| Palmers Green | N13 | £545,000 | 212 |
| Enfield | EN1, EN2 | £500,000 | 682 |
| Edmonton | N9, N18 | £415,000 | 301 |
| Ponders End | EN3 | £410,000 | 245 |
The median is the middle sale: half of the homes sold for more and half for less. A few very expensive sales have little effect on it, which makes it a better guide than an average.
Median sold prices by property type
| Area | Detached | Semi-detached | Terraced | Flats and maisonettes |
|---|---|---|---|---|
| Southgate and Oakwood | £914,750 | £795,000 | £615,000 | £370,000 |
| Winchmore Hill | £1,220,000 | £900,000 | £675,000 | £368,000 |
| Palmers Green | – | £776,250 | £625,000 | £390,000 |
| Enfield | £767,500 | £635,000 | £520,000 | £325,000 |
| Edmonton | – | £480,000 | £430,000 | £256,000 |
| Ponders End | – | £447,500 | £429,000 | £252,500 |
A dash means fewer than 10 detached standard sales in the year (7 in Edmonton, 7 in Ponders End and 3 in Palmers Green), which is too few for a reliable median.
What stands out
- Property type changes the price a great deal. In Edmonton, a typical terraced house sold for £430,000 and a typical flat for £256,000, a gap of £174,000. In Enfield the gap between those two types was £195,000.
- A flat is the lowest price of entry in every area. The typical flat sold for between £252,500 in Ponders End and £390,000 in Palmers Green.
- Edmonton and Ponders End sit very close together. Terraced homes sold for £430,000 and £429,000, and flats for £256,000 and £252,500.
Reading the figures with care
- No year-on-year comparison. We have deliberately not compared these figures with earlier years. The overall median moves with the mix of homes sold as well as with prices, so a change in it can look like a price trend when it is not one. For how prices have moved, see HM Land Registry’s UK House Price Index, which is published for areas such as the London Borough of Enfield.
- Standard sales only, which leaves out a lot in Edmonton and Ponders End. The figures cover the Land Registry’s standard (category A) residential sales for value, which include new builds. Its separate category B is not included. That covers repossessions, buy-to-lets that can be identified by a mortgage, transfers to non-private individuals and sales of property classed as “other”. In Edmonton the Land Registry recorded 224 category B sales of houses and flats in the same year, against 301 standard ones, and in Ponders End 178 against 245. Counting them would lower Edmonton’s overall median to about £402,000 and its flats median to about £235,000. In the other four areas category B was a much smaller share, so read the Edmonton and Ponders End figures as standard sales rather than the whole market.
- Postcode districts only approximate neighbourhoods. Southgate and Oakwood share the N14 district, so we report them together. Bush Hill Park falls inside EN1, which is part of the Enfield figure.
- Sales we did not handle are included, whichever agent sold the home.
- Houses and flats only. The Land Registry does not separate out bungalows, and it counts end-of-terrace homes as terraced.
- A figure appears only when enough sales stand behind it: 20 for an area’s overall figure and 10 for a property type.
- A median describes the market. It does not value a particular home.
If you are thinking of selling
Use these figures as background, then get a figure for your own home. Our article on how much your house is worth in Edmonton shows what recent sales can and cannot tell you, and you can request a free valuation when you are ready. The area guides, such as Edmonton and Enfield, carry the same sold-price figures alongside local information.
Based on completed sales registered at postcodes in N9, N18, EN3, EN1, EN2, N13, N14 and N21, which only approximate the areas’ boundaries. Contains HM Land Registry data © Crown copyright and database right 2026. This data is licensed under the Open Government Licence v3.0.
Questions readers ask
What is a median price?
The middle sale price: half of the homes sold for more and half for less. A few very expensive sales have little effect on it, which is why it is a better guide than an average.
Is this what my home is worth?
No. It shows where the middle of the market sat over the year. What a particular home is worth depends on its type, size, condition, street and the state of the market when it is sold. A free valuation looks at your actual property.
Do these figures show prices rising or falling?
No, and we have deliberately not compared them with earlier years. The overall median moves with the mix of homes sold as well as with prices, so a change in it can look like a price trend when it is not one. HM Land Registry’s UK House Price Index is the place to look for price movement.
Why are Southgate and Oakwood shown together?
Both use the N14 postcode district, and the Land Registry records sales by postcode, so the data cannot tell the two apart.
Why does the data stop at July 2026?
The Land Registry says there is typically a gap of two weeks to two months between a sale and its registration, and that data for the two most recent months is incomplete. August 2026 had far fewer recorded sales than a normal month when we loaded the data on 7 October, so we have left it out.
Sources
- HM Land Registry, About the Price Paid Data, GOV.UK. Read on 16 October 2026.
- HM Land Registry, UK House Price Index: reports, GOV.UK. Read on 16 October 2026.
- Our own calculations from Price Paid Data loaded on 7 October 2026. The method is the one used for the sold-price figures in our area guides, with the window ending in July so that the last month is complete.